
Page 117 - User’s Manual
P. 117
Size legend Select legend sub shape > Drag handle to change its size.
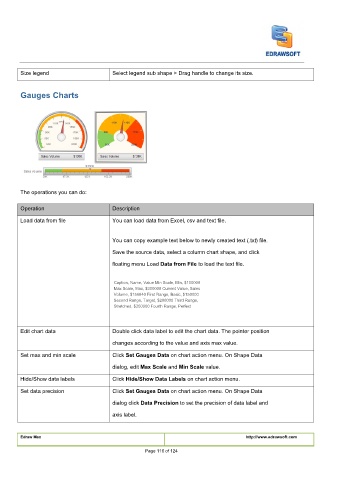
Gauges Charts
The operations you can do:
Operation Description
Load data from file You can load data from Excel, csv and text file.
You can copy example text below to newly created text (.txt) file.
Save the source data, select a column chart shape, and click
floating menu Load
floating menu Load
floating menu Load Data from File to load the text file. Data from File to load the text file. Data from File to load the text file.
Caption, Name, Value Min Scale, Min, $100000
Max Scale, Max, $300000 Current Value, Sales
Volume, $156840 First Range, Basic, $150000
Second Range, Target, $200000 Third Range,
Stretched, $250000 Fourth Range, Perfect
Edit chart data Double click data label to edit the chart data. The pointer position
changes according to the value and axis max value.
Set max and min scale Click
Click
Click Set Gauges Data on chart action menu. On Shape Data Set Gauges Data on chart action menu. On Shape Data Set Gauges Data on chart action menu. On Shape Data
dialog, edit
dialog, edit
dialog, edit Max Scale and Min Scale value. Max Scale and Min Scale value. Max Scale and Min Scale value. Max Scale and Min Scale value. Max Scale and Min Scale value.
dialog, edit
dialog, edit
Hide/Show data labels Click Hide/Show Data Labels on chart action menu. Hide/Show Data Labels on chart action menu. Hide/Show Data Labels on chart action menu.
Click
Click
Click
Click Set Gauges Data on chart action menu. On Shape Data Set Gauges Data on chart action menu. On Shape Data Set Gauges Data on chart action menu. On Shape Data
Set data precision Click
dialog click
dialog click
dialog click Data Precision to set the precision of data label and Data Precision to set the precision of data label and Data Precision to set the precision of data label and
axis label.
Edraw Max http://www.edrawsoft.com
Page 116 of 124