
Page 113 - User’s Manual
P. 113
dialog set
dialog set Axis Ticker Number value. Axis Ticker Number value. Axis Ticker Number value.
dialog set
Change the axis label Click
Click Appearance Options on chart action menu. On Shape Data Appearance Options on chart action menu. On Shape Data Appearance Options on chart action menu. On Shape Data
Click
dialog, click Axis Label Orientation to change axis label orientation. Axis Label Orientation to change axis label orientation. Axis Label Orientation to change axis label orientation.
dialog, click
orientation dialog, click
Click Hide/Show Legend on chart action menu. Hide/Show Legend on chart action menu. Hide/Show Legend on chart action menu.
Hide/Show legend Click
Click
Click Show Legend on Right/Bottom Side on chart action menu. Show Legend on Right/Bottom Side on chart action menu. Show Legend on Right/Bottom Side on chart action menu.
Show legend on right / Click
Click
bottom side of the line This menu item is hidden when legend is hidden.
chart
Move legend Select legend sub shape > Move it to the position you want.
Size legend Select legend sub shape > Drag handle to change its size.
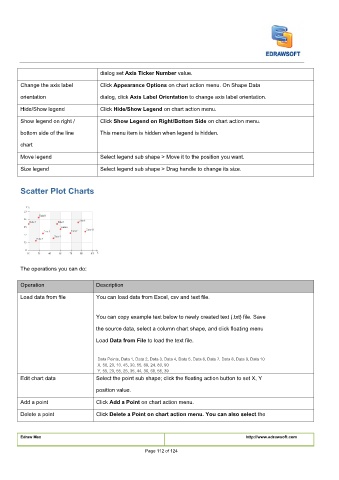
Scatter Plot Charts
The operations you can do:
Operation Description
Load data from file You can load data from Excel, csv and text file.
You can copy example text below to newly created text (.txt) file. Save
the source data, select a column chart shape, and click floating menu
Load Data from File to load the text file. Data from File to load the text file. Data from File to load the text file.
Load
Load
Data Points, Data 1, Data 2, Data 3, Data 4, Data 5, Data 6, Data 7, Data 8, Data 9, Data 10
X, 50, 20, 10, 45, 30, 55, 69, 24, 80, 90
Y, 55, 20, 55, 25, 35, 44, 36, 68, 58, 39
Edit chart data Select the point sub shape; click the floating action button to set X, Y
position value.
Add a point Click
Click Add a Point on chart action menu. Add a Point on chart action menu. Add a Point on chart action menu.
Click
Delete a point Click Delete a Point on chart action menu. You can also select the Delete a Point on chart action menu. You can also select the Delete a Point on chart action menu. You can also select the
Click
Click
Edraw Max http://www.edrawsoft.com
Page 112 of 124