
Page 114 - User’s Manual
P. 114
point sub shape and press
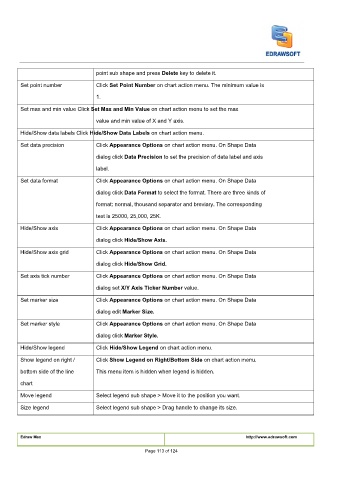
point sub shape and press Delete key to delete it. Delete key to delete it. Delete key to delete it.
point sub shape and press
Click
Set point number Click
Click Set Point Number on chart action menu. The minimum value is Set Point Number on chart action menu. The minimum value is Set Point Number on chart action menu. The minimum value is
1.
Set max and min value Click Set Max and Min Value on chart action menu to set the max Set Max and Min Value on chart action menu to set the max Set Max and Min Value on chart action menu to set the max
Set max and min value Click
Set max and min value Click
value and min value of X and Y axis.
Hide/Show data labels Click
Hide/Show data labels Click Hide/Show Data Labels on chart action menu. Hide/Show Data Labels on chart action menu. Hide/Show Data Labels on chart action menu.
Hide/Show data labels Click
Set data precision Click Appearance Options on chart action menu. On Shape Data Appearance Options on chart action menu. On Shape Data Appearance Options on chart action menu. On Shape Data
Click
Click
dialog click
dialog click
dialog click Data Precision to set the precision of data label and axis Data Precision to set the precision of data label and axis Data Precision to set the precision of data label and axis
label.
Click Appearance Options on chart action menu. On Shape Data Appearance Options on chart action menu. On Shape Data Appearance Options on chart action menu. On Shape Data
Click
Set data format Click
dialog click
dialog click
dialog click Data Format to select the format. There are three kinds of Data Format to select the format. There are three kinds of Data Format to select the format. There are three kinds of Data Format to select the format. There are three kinds of
dialog click
format: normal, thousand separator and breviary. The corresponding
text is 25000, 25,000, 25K.
Hide/Show axis Click Appearance Options on chart action menu. On Shape Data Appearance Options on chart action menu. On Shape Data Appearance Options on chart action menu. On Shape Data
Click
Click
dialog click
dialog click Hide/Show Axis.Hide/Show Axis.
Click Appearance Options on chart action menu. On Shape Data Appearance Options on chart action menu. On Shape Data Appearance Options on chart action menu. On Shape Data
Click
Hide/Show axis grid Click
dialog click
dialog click Hide/Show Grid.Hide/Show Grid.
Click
Click Appearance Options on chart action menu. On Shape Data Appearance Options on chart action menu. On Shape Data Appearance Options on chart action menu. On Shape Data
Set axis tick number Click
dialog set
dialog set
dialog set
dialog set X/Y Axis Ticker Number value. X/Y Axis Ticker Number value. X/Y Axis Ticker Number value. X/Y Axis Ticker Number value.
Click Appearance Options on chart action menu. On Shape Data Appearance Options on chart action menu. On Shape Data Appearance Options on chart action menu. On Shape Data
Set marker size Click
Click
dialog edit Marker Size.Marker Size.
dialog edit
Click Appearance Options on chart action menu. On Shape Data Appearance Options on chart action menu. On Shape Data Appearance Options on chart action menu. On Shape Data
Click
Set marker style Click
dialog click
dialog click Marker Style.Marker Style.
Hide/Show legend Click Hide/Show Legend on chart action menu. Hide/Show Legend on chart action menu. Hide/Show Legend on chart action menu.
Click
Click
Click
Click Show Legend on Right/Bottom Side on chart action menu. Show Legend on Right/Bottom Side on chart action menu. Show Legend on Right/Bottom Side on chart action menu.
Show legend on right / Click
bottom side of the line This menu item is hidden when legend is hidden.
chart
Move legend Select legend sub shape > Move it to the position you want.
Size legend Select legend sub shape > Drag handle to change its size.
Edraw Max http://www.edrawsoft.com
Page 113 of 124