
Page 119 - User’s Manual
P. 119
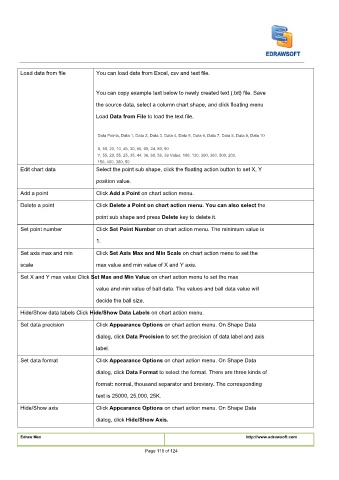
Load data from file        You can load data from Excel, csv and text file.


                                   You can copy example text below to newly created text (.txt) file. Save
                                   the source data, select a column chart shape, and click floating menu

                                   Load
                                   Load
                                   Load Data from File to load the text file.  Data from File to load the text file.  Data from File to load the text file.
                                   Data Points, Data 1, Data 2, Data 3, Data 4, Data 5, Data 6, Data 7, Data 8, Data 9, Data 10

                                   X, 50, 20, 10, 45, 30, 55, 69, 24, 80, 90
                                   Y, 55, 20, 55, 25, 35, 44, 36, 68, 58, 39 Value, 100, 130, 300, 360, 500, 200,
                                   150, 400, 380, 50
        Edit chart data            Select the point sub shape, click the floating action button to set X, Y

                                   position value.

                                   Click
                                   Click
        Add a point                Click Add a Point on chart action menu.  Add a Point on chart action menu.  Add a Point on chart action menu.
                                   Click Delete a Point on chart action menu. You can also select the Delete a Point on chart action menu. You can also select the Delete a Point on chart action menu. You can also select the
        Delete a point             Click
                                   Click
                                   point sub shape and press
                                   point sub shape and press
                                   point sub shape and press Delete key to delete it. Delete key to delete it. Delete key to delete it.
                                   Click
                                   Click
        Set point number           Click Set Point Number on chart action menu. The minimum value is Set Point Number on chart action menu. The minimum value is Set Point Number on chart action menu. The minimum value is
                                   1.
                                   Click Set Axis Max and Min Scale on chart action menu to set the Set Axis Max and Min Scale on chart action menu to set the Set Axis Max and Min Scale on chart action menu to set the
                                   Click
        Set axis max and min       Click
        scale                      max value and min value of X and Y axis.
        Set X and Y max value Click
        Set X and Y max value Click Set Max and Min Value on chart action menu to set the max Set Max and Min Value on chart action menu to set the max Set Max and Min Value on chart action menu to set the max
        Set X and Y max value Click
                                   value and min value of ball data. The values and ball data value will
                                   decide the ball size.

        Hide/Show data labels Click Hide/Show Data Labels on chart action menu. Hide/Show Data Labels on chart action menu. Hide/Show Data Labels on chart action menu.
        Hide/Show data labels Click
        Hide/Show data labels Click
                                   Click Appearance Options on chart action menu. On Shape Data Appearance Options on chart action menu. On Shape Data Appearance Options on chart action menu. On Shape Data
                                   Click
        Set data precision         Click
                                   dialog, click Data Precision to set the precision of data label and axis Data Precision to set the precision of data label and axis Data Precision to set the precision of data label and axis
                                   dialog, click
                                   dialog, click
                                   label.
                                   Click
                                   Click
        Set data format            Click Appearance Options on chart action menu. On Shape Data Appearance Options on chart action menu. On Shape Data Appearance Options on chart action menu. On Shape Data
                                   dialog, click
                                   dialog, click
                                   dialog, click
                                   dialog, click Data Format to select the format. There are three kinds of Data Format to select the format. There are three kinds of Data Format to select the format. There are three kinds of Data Format to select the format. There are three kinds of
                                   format: normal, thousand separator and breviary. The corresponding
                                   text is 25000, 25,000, 25K.

        Hide/Show axis             Click
                                   Click Appearance Options on chart action menu. On Shape Data Appearance Options on chart action menu. On Shape Data Appearance Options on chart action menu. On Shape Data
                                   Click
                                   dialog, click
                                   dialog, click Hide/Show Axis.Hide/Show Axis.
        Edraw Max                                                                      http://www.edrawsoft.com

                                                    Page 118 of 124