
Page 118 - User’s Manual
P. 118
Click
Click Set Gauges Data on chart action menu. On Shape Data Set Gauges Data on chart action menu. On Shape Data Set Gauges Data on chart action menu. On Shape Data
Set data format Click
dialog click
dialog click
dialog click Data Format to select the format. There are three Data Format to select the format. There are three Data Format to select the format. There are three
kinds of format: normal, thousand separator and breviary. The
corresponding text is 25000, 25,000, 25K.
Click
Click Set Gauges Data on chart action menu. On Shape Data Set Gauges Data on chart action menu. On Shape Data Set Gauges Data on chart action menu. On Shape Data
Set unit Click
dialog input the prefix unit and unit. The prefix unit and unit will
only be displayed on data label, e.g. $1800 and 1800 US dollar.
Set axis tick number Click
Click
Click Set Gauges Data on chart action menu. On Shape Data Set Gauges Data on chart action menu. On Shape Data Set Gauges Data on chart action menu. On Shape Data
dialog, edit
dialog, edit
dialog, edit Tick Number value. Tick Number value. Tick Number value.
Set range number Click
Click
Click Set Range Number on chart action menu. The range Set Range Number on chart action menu. The range Set Range Number on chart action menu. The range
number can be from 1 to 5.
Set range data Click Set Range Data on chart action menu. On Shape Data Set Range Data on chart action menu. On Shape Data Set Range Data on chart action menu. On Shape Data
Click
Click
dialog, edit the range data.
Hide/Show legend Click Hide/Show Legend on chart action menu. Hide/Show Legend on chart action menu. Hide/Show Legend on chart action menu.
Click
Click
Click
Click
Show legend on right / Click Show Legend on Right/Bottom Side on chart action Show Legend on Right/Bottom Side on chart action Show Legend on Right/Bottom Side on chart action
bottom side of the line chart menu. This menu item is hidden when legend is hidden.
Move legend Select legend sub shape > Move it to the position you want.
Size legend Select legend sub shape > Drag handle to change its size.
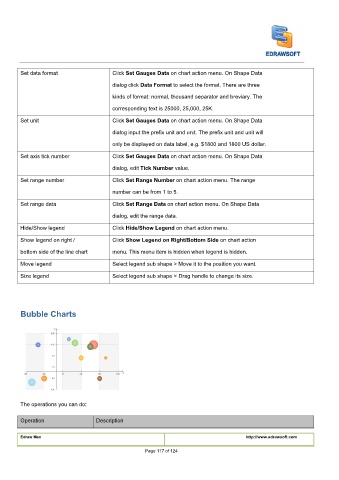
Bubble Charts
The operations you can do:
Operation Description
Edraw Max http://www.edrawsoft.com
Page 117 of 124