
Page 112 - User’s Manual
P. 112
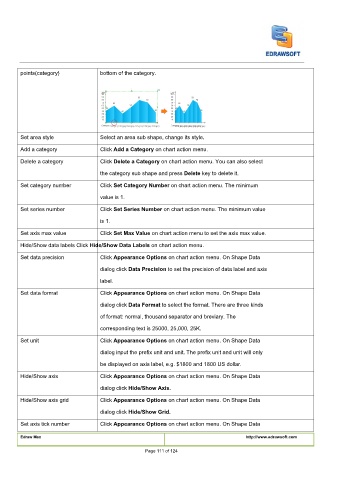
points(category)            bottom of the category.


        Set area style              Select an area sub shape, change its style.

                                    Click
        Add a category              Click Add a Category on chart action menu. Add a Category on chart action menu. Add a Category on chart action menu.
                                    Click
                                    Click
                                    Click
        Delete a category           Click Delete a Category on chart action menu. You can also select Delete a Category on chart action menu. You can also select Delete a Category on chart action menu. You can also select
                                    the category sub shape and press
                                    the category sub shape and press
                                    the category sub shape and press Delete key to delete it. Delete key to delete it. Delete key to delete it.
                                    Click
                                    Click Set Category Number on chart action menu. The minimum Set Category Number on chart action menu. The minimum Set Category Number on chart action menu. The minimum
        Set category number         Click
                                    value is 1.
        Set series number           Click Set Series Number on chart action menu. The minimum value Set Series Number on chart action menu. The minimum value Set Series Number on chart action menu. The minimum value
                                    Click
                                    Click
                                    is 1.
                                    Click
                                    Click
        Set axis max value          Click Set Max Value on chart action menu to set the axis max value. Set Max Value on chart action menu to set the axis max value. Set Max Value on chart action menu to set the axis max value.
        Hide/Show data labels Click
        Hide/Show data labels Click Hide/Show Data Labels on chart action menu. Hide/Show Data Labels on chart action menu. Hide/Show Data Labels on chart action menu.
        Hide/Show data labels Click
                                    Click Appearance Options on chart action menu. On Shape Data Appearance Options on chart action menu. On Shape Data Appearance Options on chart action menu. On Shape Data
                                    Click
        Set data precision          Click
                                    dialog click
                                    dialog click Data Precision to set the precision of data label and axis Data Precision to set the precision of data label and axis Data Precision to set the precision of data label and axis
                                    dialog click
                                    label.
                                    Click Appearance Options on chart action menu. On Shape Data Appearance Options on chart action menu. On Shape Data Appearance Options on chart action menu. On Shape Data
        Set data format             Click
                                    Click
                                    dialog click
                                    dialog click
                                    dialog click
                                    dialog click Data Format to select the format. There are three kinds Data Format to select the format. There are three kinds Data Format to select the format. There are three kinds Data Format to select the format. There are three kinds
                                    of format: normal, thousand separator and breviary. The
                                    corresponding text is 25000, 25,000, 25K.

                                    Click
                                    Click Appearance Options on chart action menu. On Shape Data Appearance Options on chart action menu. On Shape Data Appearance Options on chart action menu. On Shape Data
        Set unit                    Click
                                    dialog input the prefix unit and unit. The prefix unit and unit will only
                                    be displayed on axis label, e.g. $1800 and 1800 US dollar.

                                    Click
                                    Click Appearance Options on chart action menu. On Shape Data Appearance Options on chart action menu. On Shape Data Appearance Options on chart action menu. On Shape Data
        Hide/Show axis              Click
                                    dialog click
                                    dialog click Hide/Show Axis.Hide/Show Axis.
                                    Click
                                    Click Appearance Options on chart action menu. On Shape Data Appearance Options on chart action menu. On Shape Data Appearance Options on chart action menu. On Shape Data
        Hide/Show axis grid         Click
                                    dialog click
                                    dialog click Hide/Show Grid.Hide/Show Grid.
                                    Click
                                    Click Appearance Options on chart action menu. On Shape Data Appearance Options on chart action menu. On Shape Data Appearance Options on chart action menu. On Shape Data
        Set axis tick number        Click
        Edraw Max                                                                      http://www.edrawsoft.com

                                                    Page 111 of 124