
Page 116 - User’s Manual
P. 116
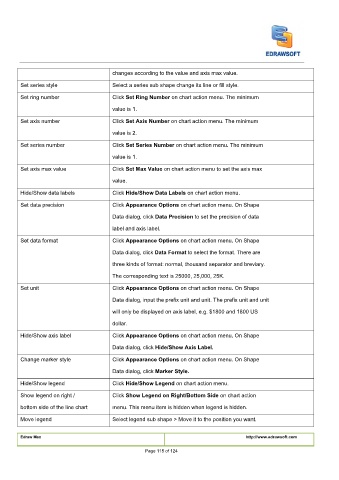
changes according to the value and axis max value.

        Set series style                Select a series sub shape change its line or fill style.
                                        Click
                                        Click Set Ring Number on chart action menu. The minimum Set Ring Number on chart action menu. The minimum Set Ring Number on chart action menu. The minimum
        Set ring number                 Click
                                        value is 1.

                                        Click Set Axis Number on chart action menu. The minimum Set Axis Number on chart action menu. The minimum Set Axis Number on chart action menu. The minimum
                                        Click
        Set axis number                 Click
                                        value is 2.
                                        Click
        Set series number               Click
                                        Click Set Series Number on chart action menu. The minimum Set Series Number on chart action menu. The minimum Set Series Number on chart action menu. The minimum
                                        value is 1.
        Set axis max value              Click
                                        Click
                                        Click Set Max Value on chart action menu to set the axis max Set Max Value on chart action menu to set the axis max Set Max Value on chart action menu to set the axis max
                                        value.
        Hide/Show data labels           Click Hide/Show Data Labels on chart action menu. Hide/Show Data Labels on chart action menu. Hide/Show Data Labels on chart action menu.
                                        Click
                                        Click
                                        Click
                                        Click Appearance Options on chart action menu. On Shape Appearance Options on chart action menu. On Shape Appearance Options on chart action menu. On Shape
        Set data precision              Click
                                        Data dialog, click
                                        Data dialog, click Data Precision to set the precision of data Data Precision to set the precision of data Data Precision to set the precision of data
                                        Data dialog, click
                                        label and axis label.
                                        Click
        Set data format                 Click Appearance Options on chart action menu. On Shape Appearance Options on chart action menu. On Shape Appearance Options on chart action menu. On Shape
                                        Click
                                        Data dialog, click Data Format to select the format. There are Data Format to select the format. There are Data Format to select the format. There are
                                        Data dialog, click
                                        Data dialog, click
                                        three kinds of format: normal, thousand separator and breviary.
                                        The corresponding text is 25000, 25,000, 25K.
                                        Click
                                        Click
        Set unit                        Click Appearance Options on chart action menu. On Shape Appearance Options on chart action menu. On Shape Appearance Options on chart action menu. On Shape
                                        Data dialog, input the prefix unit and unit. The prefix unit and unit

                                        will only be displayed on axis label, e.g. $1800 and 1800 US
                                        dollar.

                                        Click Appearance Options on chart action menu. On Shape Appearance Options on chart action menu. On Shape Appearance Options on chart action menu. On Shape
                                        Click
        Hide/Show axis label            Click
                                        Data dialog, click Hide/Show Axis Label.Hide/Show Axis Label.
                                        Data dialog, click
                                        Click
                                        Click Appearance Options on chart action menu. On Shape Appearance Options on chart action menu. On Shape Appearance Options on chart action menu. On Shape
        Change marker style             Click
                                        Data dialog, click
                                        Data dialog, click Marker Style.Marker Style.
        Hide/Show legend                Click
                                        Click
                                        Click Hide/Show Legend on chart action menu. Hide/Show Legend on chart action menu. Hide/Show Legend on chart action menu.
                                        Click
                                        Click Show Legend on Right/Bottom Side on chart action Show Legend on Right/Bottom Side on chart action Show Legend on Right/Bottom Side on chart action
        Show legend on right /          Click
        bottom side of the line chart   menu. This menu item is hidden when legend is hidden.
        Move legend                     Select legend sub shape > Move it to the position you want.


        Edraw Max                                                                      http://www.edrawsoft.com

                                                    Page 115 of 124